Despite being a garbage-collected language, memory leaks are still possible (and quite common) in Java. The simplest example is an in-memory data structure that grows with every unit of work performed by the system. For example, imagine you store an in-memory log for every request/response you process, and never bound the size or flush to disk.
Some other examples include:
- File leaks, where a file or socket is not closed. These consume both memory and OS file handles and will eventually fail.
- ThreadLocal leaks, where threads are reused between work and threadlocals are not explicitly cleared
- Classloader leaks, which involve the use of custom classloaders and class unloading.
Detection
Memory leaks can be surprisingly challenging to detect. If you just look at a heap diagram of a normal (non-leaky) application you’ll see some sort of sawtooth behavior.
With a leak the floor of the sawtooth rises as each successive GC fails to release some of the long-lived memory.
In practice what we’re looking for is memory pressure. There are a few approaches to identifying issues.
Look at “live” heap.
We can look at the size of the “live” heap that remains after each GC cycle. With a generational garbage collector like G1 this is roughly the size of the tenured generation. If you’re using one of the newer collectors like Shenandoah or ZGC you’ll have to wait for JDK21 to get this.
Look at time spent in GC.
Often as a memory leak progresses we’ll see a steadily increasing amount of time spent in GC.
All of this information is available from
the GarbageCollectorMBean
from JMX, the Java Management Extensions.
Diagnosing a leak
Now that we know there’s a memory leak, how do we actually find and fix it?
Let’s use an example:
class LeakyFunction {

  // Track in-flight actions.
  private final Set<String> inflightActions = ConcurrentHashMap.newKeySet();

  /**
   * Do something.
   */
  public String call(String actionId, String input) {
    // Store the action id.
    inflightActions.add(actionId);

    String result = doSomeAction(input);

    // BUG: Forget to release resources 30% of the time.
    boolean shouldSkip = RandomUtils.nextDouble(0, 1) < 0.3;
    if (!shouldSkip) {
      // Remove the action id.
      inflightActions.remove(actionId);
    }

    return result;
  }
}
Class Histogram
The cheapest/simplest option is to take a class histogram using jcmd. This will trigger a full GC,
and only show us objects that remain.
With our example leak class we see something like this:
[1] % jcmd <pid> GC.class_histogram
num     #instances         #bytes  class name (module)
-------------------------------------------------------
   1:        521778       29893184  [B (java.base@17.0.2)
   2:        511434       20457360  java.util.concurrent.ConcurrentHashMap$Node (java.base@17.0.2)
   3:        520698       16662336  java.lang.String (java.base@17.0.2)
   4:            76        8992320  [Ljava.util.concurrent.ConcurrentHashMap$Node; (java.base@17.0.2)
   5:          2311         440400  java.lang.Class (java.base@17.0.2)
   6:          2345         262640  java.lang.reflect.Field (java.base@17.0.2)
   7:          2525         242160  [Ljava.lang.Object; (java.base@17.0.2)
   8:          1497         206240  [Ljava.util.HashMap$Node; (java.base@17.0.2)
   9:          1142         164448  java.lang.reflect.Method (java.base@17.0.2)
  10:          3275         131000  java.util.HashMap$Node (java.base@17.0.2)
  ...
This tells us that byte[], ConcurrentHashMap$Node, and String take up most of our heap, but it
doesn’t tell us where they’re coming from. The ConcurrentHashMap$Node is the only interesting
piece of information we can really gather from this. You can potentially combine this information
with a suspected git commit to narrow down the source of the leak.
Full Heap dump
The most expensive option is to take a full heap dump. This lets us look inside of memory and understand which objects are retaining the most amount of space. We can also trace the objects back to their GC roots to understand what is holding onto the memory.
We can take a heap dump using:
jcmd <pid> GC.heap_dump
This will force a full GC and return only non-live objects. Running our example for 60 seconds we get a ~100MB file. Note that I’ve intentionally set the max heap size to 128MB to limit the size of this heap dump - in practice heap dumps can be much larger.
(NOTE: The following screenshots are from YourKit but you can also use jvisualvm.)
First we can look for the largest retained objects in memory:

Then we can calculate the shortest path to GC roots:

We can see that the inflightActions Map has been identified as the culprit. Note that this doesn’t
tell us which code path is actually causing the leak, but this is typically enough information to
track it down.
The main problem with heap dumps is that they’re difficult to take in live production environments. They can be very large (they are at least the size of the retained set), they lock up applications while they run, and they can expose sensitive information from production environments like PII and encryption/decryption keys.
Java Flight Recorder events
JDK11 introduced Java Flight Recorder (JFR), a low overhead tool for profiling Java applications.
The most relevant ability is to sample events for “Old Objects”, including their heap usage and paths back to the allocation roots. This is available starting in JDK11.
We run the application again for 60 seconds with the following args:
# NOTE: memory-leaks=gc-roots requires JDK17+, otherwise take a full profile
java -XX:StartFlightRecording:memory-leaks=gc-roots,maxsize=1G,filename=/tmp/ ...
The resulting snapshot is only ~700KB!
Loading this into the YourKit profiler we see that there are Old Object Sample Events:

We can group by the Object Class type and see the 3 classes we saw in the histogram above:

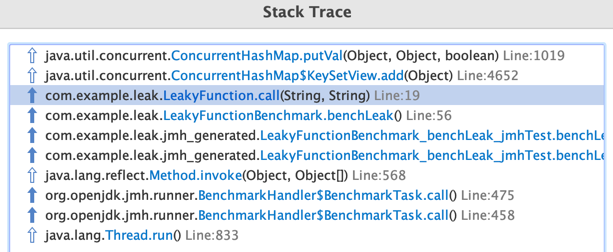
And the stack trace now takes us right to the cause!

While this approach seems strictly superior, it’s worth noting that these events are sampled and may be drowned out by other legitimate writes to old objects, e.g. in-memory cache writes. There’s also some small overhead to running JFR in production, on the order of < 2% CPU.
Summary
The 3 approaches outlined here in order of cost are:
- Class Histogram: The easiest to run but often not helpful.
- Old Object sample events: Extremely helpful if the leak is in the set of samples. Requires profiling in production.
- Full Heap Dump: By far the most expensive to run and analyze, but they contain complete information about the heap.